
6th Grade Math Worksheets
Count on our printable 6th grade math worksheets with answer keys for a thorough practice. With strands drawn from vital math topics like ratio, multiplication, division, fractions, common factors and multiples, rational numbers, algebraic expressions, integers, one-step equations, ordered pairs in the four quadrants, and geometry skills like determining area, surface area, and volume, organizing numerical data as dot plots, histograms and box plots, finding mean, median, and quartiles of datasets, these pdfs become your often go-to place. Grab your ticket to a great start with our free math worksheets for grade 6 students!
Select Grade 6 Math Worksheets by Topic
Explore 190+ Sixth Grade Statistics and Probability Worksheets
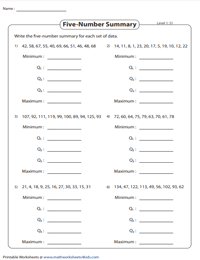
Analyze each data set and jot down the maximum and minimum values, and the first, second, and third quartiles.
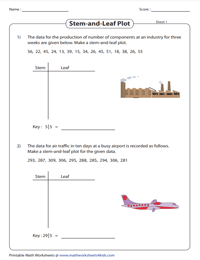
Observe each scenario, order the data values, split the digits into stem and leaf, and make the plot.
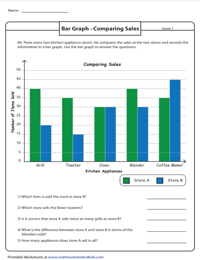
Reading and Interpreting Double Bar Graphs
Read the double bar graphs representing two data sets, compare the data values, and answer the questions that follow.
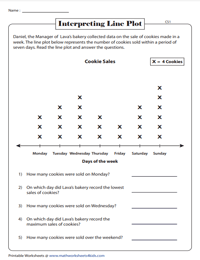
Interpreting Line Plot | Key Increments
The key of a line plot is nothing but a scale. Interpret the plot, and multiply each value with the key while answering questions.
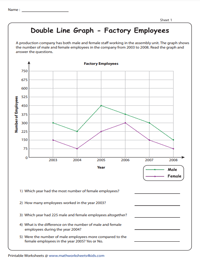
Compare the data points connected by the two lines, and respond to questions below the graph.
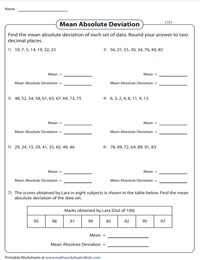
Mean Absolute Deviation | Up to 6 Data Values | Level 1
Fill in the table with the mean, deviation, difference, absolute values; find the average of the last column to calculate MAD.
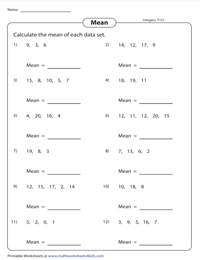
Finding Mean | Up to 4 Data Points
Add up the data values presented in the range 1 to 10, and divide the sum by the number of values to arrive at the mean.
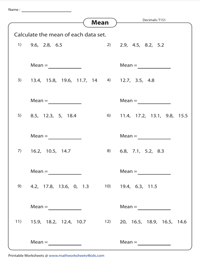
The decimal data values, when put together and divided by 3 or 4 according to the count, will give you the mean.
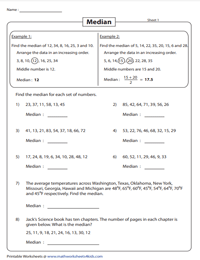
Arrange the numbers in ascending order, and write down the number(s) in the middle as the median.
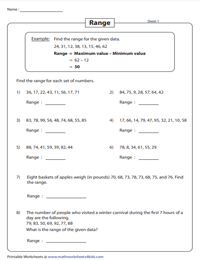
Pick out the maximum and minimum values from a data set, find the difference between the two to obtain the range.
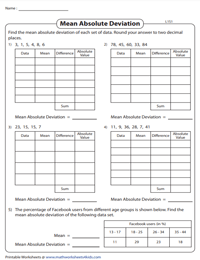
Mean Absolute Deviation | Up to 10 Data Values | Level 1
Write the mean of the data set, compute |data value - mean|, and find the average of these absolute values.
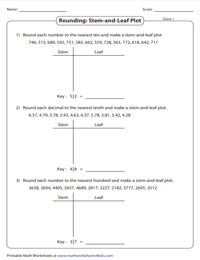
Rounding and Making Stem and Leaf plots
Round the numbers and decimals to the indicated place value, create the stem and leaf plot, and fill in with the key.
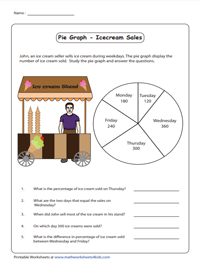
Converting Whole-Number Data on Pie Graphs to Percent
Sum up all data values and divide each value by the sum to convert it to percent; answer questions interpreting the graph.