- Worksheets>
- Math>
- Statistics>
- Pie Graph
Pie Graph Worksheets
Our printable pie graph (circle graph) worksheets consist of interpreting data in whole numbers, fractions and percentage; representing data in fractions or percent; drawing a pie diagram and more. The pie graphs are designed based on different interesting themes. The pdf worksheets cater to the requirements of students in grade 4 through grade 7. Try our free pie graph worksheets with just a single click!
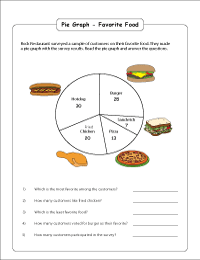
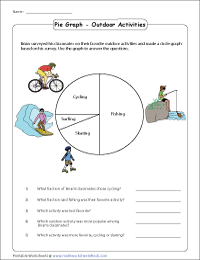
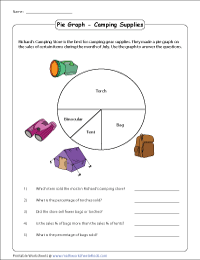
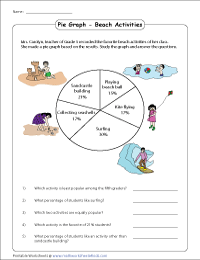
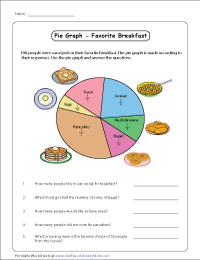
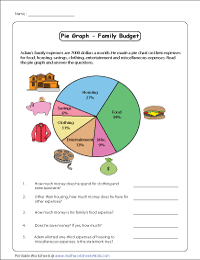
The pie graphs in this pdf practice set contain three fascinating themes. Beginners can learn how to interpret data using these pie graphs.
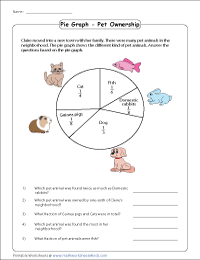
Reading Pie Graphs: Basic Fraction
The printable worksheets for 4th grade and 5th grade kids are based on fundamental fractions. The pie graph is divided into simple fractions like quarters and halves.
Reading Pie Graphs: Basic Percent
The pie graphs are based on the basic percentage. Use 25% and 50% as the standard scales to interpret each pie graph.
Interpreting Pie Graphs in Percentage
Each pie graph contains data in percentage. The graphs are designed based on three unique themes. Answer the questions using the pie graph.
Interpreting Pie Graphs in Fraction
These pie graph worksheet pdfs are based on interpreting data in fractions. Observe the pie graph and answer the questions.
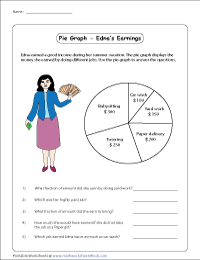
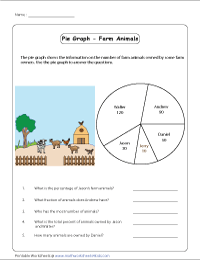
Convert the Data from Whole Number to Fraction
Each worksheet contains five questions based on the pie graphs. At least, two questions require conversion of a whole number into fractions.
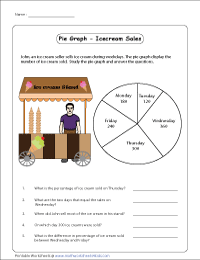
Convert the Data from Whole Number to Percent
The pie graph in these printable worksheets for grade 5, grade 6, and grade 7 require conversion of a whole number into percentage.
Convert the Data into either Fraction or Percent
Study the pie graph and answer the questions by converting the data into either fraction or percentage accordingly.
Convert from Fraction to Whole Number
The pie graphs are divided in fractions. The exercises are based on converting fractions to a whole number.
Convert from Percentage to Whole Number
Each printable worksheet has a circle graph (pie graph) based on conversion of percentage to a whole number to facilitate effective practice for 6th grade and 7th grade students.
Drawing Pie Graphs: 30 Degree Increment
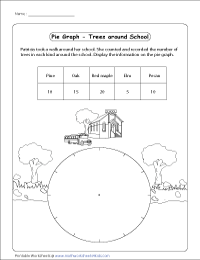
Draw your own pie graph using the data given in the table. Students can use the circle already drawn in 30 degree increment.
Draw a Pie Graph using a Protractor
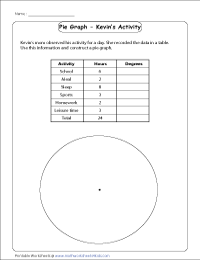
Calculate the degree for each item in the data. Draw a pie graph using a protractor based on your calculation.

