- Worksheets>
- Math>
- Statistics
Statistics and Data Analysis Worksheets
The key to growth is to bring order to chaos. Learn to organize data with the statistics worksheets here featuring exercises to present data in visually appealing pictographs, line graphs, bar graphs and more. Determine the mean, median, mode and also find worksheets on permutation, combination, probability and factorials to mention a few.
List of Statistics and Data Analysis Worksheets
Explore the Statistics and Data Analysis Worksheets in Detail
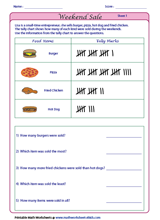
Let's go back in history and learn a fun way to count with this batch of Tally worksheets, featuring colorful and engaging activities to count and read tally marks, spinner board activities, classifying and counting tally marks, word problems and a lot more.
The assemblage here provides interesting printable pictograph worksheets with themed activities to present or interpret information in the form of pictures. Find tasks like drawing and comprehending a pictograph, counting and grouping pictures with varied levels of difficulty.
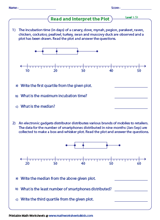
This collection of line plot worksheets provides plenty of engaging activities that emphasize on making, comprehending and interpreting line plots and also provide ideas for surveys. Templates are included for children to take up surveys of their interest.
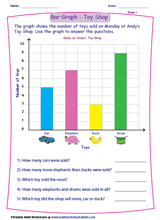
The meticulously designed bar graph worksheets here, grab the attention of the learners with colorful pictures and interesting themes. Learn to draw and read bar graphs, double bar graphs, write titles, label axis, make a scale and represent data as bar graphs to mention a few.
Build your skills with this set of line graph worksheets to analyze and interpret line graphs. Enrich your knowledge with activities like drawing line graphs, interpreting line graphs, double line graphs with appropriate scales, titles and labelled axis.
Focusing on pie graphs or circle graphs, these printable worksheets involve exercises to observe, visualize and comprehend pie graphs, convert percentages, whole numbers, fractions to pie graphs and vice-versa, drawing pie graphs with 30° increment, using a protractor to draw a pie graph and a lot more.
Use these worksheets to practice displaying the relationship between two sets of data and identifying trends, patterns, and correlations.
Check out this extensive range of mean worksheets encompassing exercises to find the arithmetic mean of whole numbers and decimals with varied levels of difficulty, calculate the mean with practical units, find the average and more.
Explore our frequency table worksheets, which feature both categorical and numerical data, and develop skills in organizing information and calculating relative frequencies.
Mean, Median, Mode and Range Worksheets
This array of mean, median, mode worksheets covers the most important aspect of statistics, comprising exercises to determine the mean, median, mode, average, quartiles and range to mention a few. Interesting word problems to apply the concept have also been enclosed.
Mean Absolute Deviation Worksheets
This collection of mean absolute deviation (MAD) worksheets comprises exercises in tabular format and as word problems involving 2-digit, 3-digit and decimal data values. Find the mean, absolute deviation and average absolute deviation using the mean absolute deviation formula. Learn comparing two data sets as well.
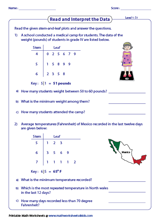
The stem and leaf plot worksheets here offer an innovative way to organize and plot data. Consisting of umpteen exercises like making and interpreting Stem and Leaf plots, back to back plots, truncate and round off to make a plot, the worksheets help in visualizing the distribution of data.
Box and Whisker Plot Worksheets
Utilize this assemblage of box and whisker plot worksheets to make and interpret box and whisker plots and to summarize a set of data. A wide range of exercises to find the five number summary, quartiles, range, inter-quartile range, outliers and word problems have been included here.
Learn to interpret and create Venn diagrams with a variety of exercises in two or three sets, shade the union or intersection, name the shaded portions, write the set notations, complete the Venn diagram and more.
Practice key set theory concepts like set notation, unions, intersections, complements, set differences, and De Morgan’s laws with our printable worksheets.
This collection of factorial worksheets introduces factorials and encompasses ample exercises to write the factorial in a product form or vice-versa, simplify and evaluate factorial expressions to hone your skills.
Figure out the possible ways of arranging a list of objects or events with this exclusive set of Permutation worksheets; packed with intriguing exercises such as listing the number of permutations, finding the number of unique permutations, evaluating expressions and solving equations involving permutations.
This cluster of combination worksheets deals solely with exercises involving combination, like listing out the combinations, finding the number of combinations, evaluating and solving combinations. Real-world scenarios and a multitude of exercises help students master combinations with ease.
Access a vast collection of probability worksheets involving exercises on probability, covering varied levels of difficulty. Find exercises to identify the sample space, likely and unlikely outcomes of an event, spinner problems, probability with single and double coins, pair of dice, deck of cards to mention a few.
Sample Worksheets