
4th Grade Math Worksheets
Endorsing learning and practice, our printable 4th grade math worksheets with answer keys amazingly fit into your curriculum. With adequate exercises in multi-digit multiplication, and division, equivalent fractions, addition and subtraction of fractions with like denominators, and multiplication of fractions by whole numbers, analyzing and classifying geometric figures based on their properties, such as parallel and perpendicular sides, angle measures, and symmetry, converting between units of measurement, making and interpreting line plots, these pdfs become the most sought after. Grab our free grade 4 math worksheets for a peek into what's in store.
Select Grade 4 Math Worksheets by Topic
Explore 160+ Fourth Grade Data and Graph Worksheets
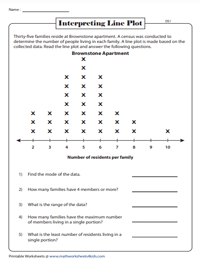
Draw conclusions from the line plot by interpreting the data and answer the set of questions based on mean, median, mode and range.
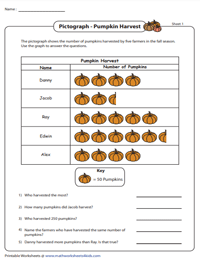
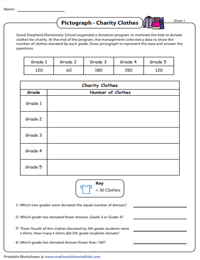
Pictures and data go hand in hand in pictographs. Read the pictograph, decipher the data with the help of the key, and solve the problems.
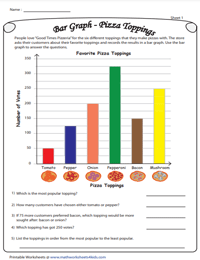
Study the bar graph with six bars, comprehend the data, and answer the questions after analyzing the data.
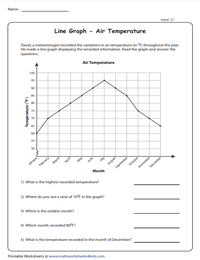
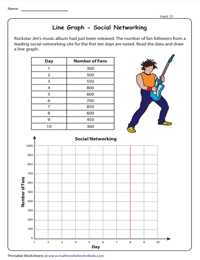
With the help of a line graph, a powerful visual tool, enable learners to interpret more than ten data points and answer the questions.
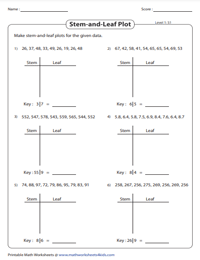
Construct a stem and leaf plot by identifying the last digit for the leaf part and all the digits before for the stem part of the plot.
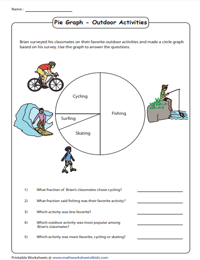
Rich with interesting scenarios, this resource requires young learners to interpret the pie graph which is divided into halves and quarters.
Drawing Venn Diagrams with Universal Sets | Word Problems
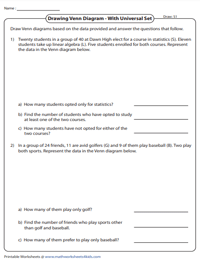
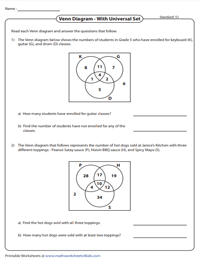
Draw a Venn diagram with two sets and populate the diagram with the key information from the given data and answer the questions.
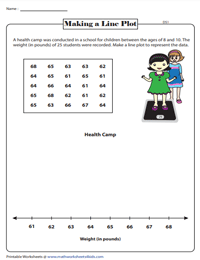
Making a line plot is not too hard. Just place 'X' marks above each data value on the number line to show the frequency of the data.
Plot a point for each pair of values and draw a line connecting the points from left to right.
With the help of the data set, create a pictograph by using appropriate symbols or pictures and respond to the questions.
Drawing Pie Graphs | 30 Degree Increment
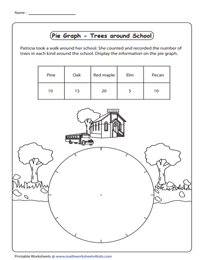
Make sense of numbers and information and draw your own pie graph by using the given circle with 30 degrees equal increments.
Venn Diagram with Three Sets | Word Problems
Draw three overlapping circles, fill them with the given data, and answer the questions based on the union and intersection of sets.