
- Worksheets>
- Math>
- Statistics>
- Bar Graph
Bar Graph Worksheets
Bar graph worksheets contain counting objects, graphing by coloring, comparing tally marks, creating graph, reading bar graph, double bar graph, drawing bar graph to represent the data, making your own survey and more. Each worksheet contains a unique theme to clearly understand the usage and necessity of a bar graph in real-life. These worksheets are highly recommended for students of grade 1 through grade 6. Access some of these handouts for free!
1st Grade Bar Graph Worksheets
Color the squares according to the number of items, and create bar graphs to represent the data in these printable hands-on worksheets.
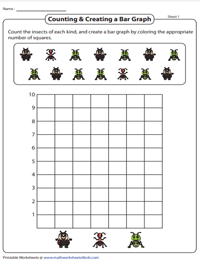
Counting and Creating Bar Graphs
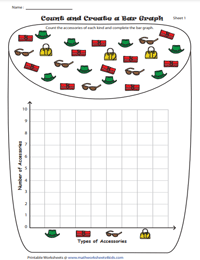
Count the pictures in each kind, color the squares with respect to the count, and make bar graphs.
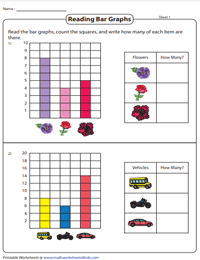
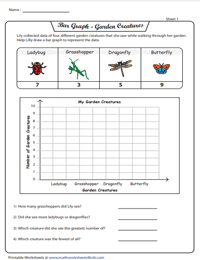
Reading Bar Graphs | Three Categories
Observe the shaded squares on the bar graphs, and list down the number of objects on the table beside.
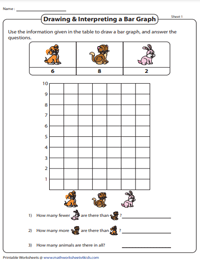
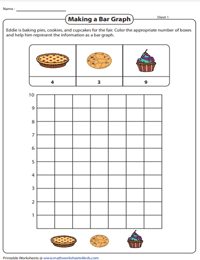
Drawing and Interpreting Bar Graphs | Three Categories
Task kids of grade 1 to draw bar graphs using the information from the table, and interpret it to answer a few questions.
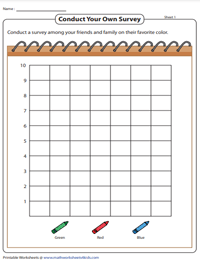
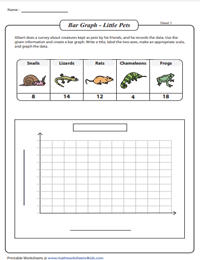
Take a survey among your friends and family members. Record the results in this chart pdf and draw a bar graph to represent your data.
2nd Grade Bar Graph Worksheets
Counting and Coloring Bar Graphs
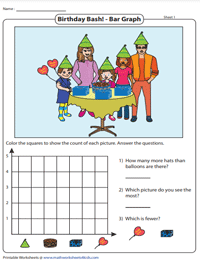
Color the graph to show the count of each picture. Answer the questions based on the bar graph.
Counting and Drawing Bar Graphs
You have a collection of objects in each printable worksheet. Count the number of objects in each kind and draw a bar graph to represent the counting.
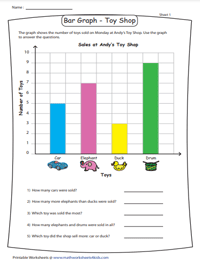
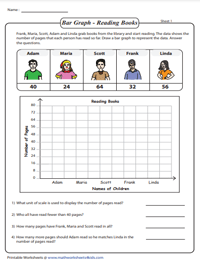
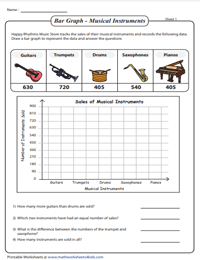
Reading Bar Graphs | Four Categories
Each worksheet has 5 questions based on reading bar graph. Scale increments by 1s. These worksheets are suitable for grade 2 kids.
Drawing and Interpreting Bar Graphs | Four Categories
Kids in 2nd grade are expected to draw a bar graph to represent the data and use the information to answer the questions.
3rd Grade Bar Graph Worksheets
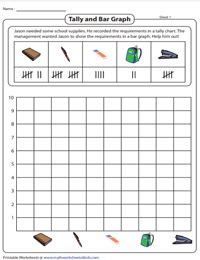
Counting of each object is represented by tally marks. Draw and color the bar graph to show the count.
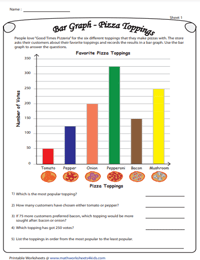
Reading Bar Graphs | Several Categories
Read the bar graph and answer the questions. Scale increments by 2s and 5s. There are 5 bars in each pdf worksheet.
Drawing and Interpreting Bar Graphs | Several Categories
Bar graph worksheets for grade 3 contain scale increments by 4s and 8s. There are four questions in each printable worksheet.
Title, Labeling Axis, Scaling and Graphing
Using the given information, write a title of the bar graph, label x and y axis, make appropriate scale, and draw a graph to represent the data.
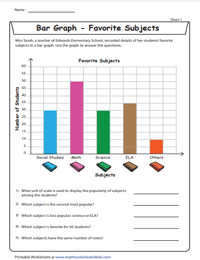
Bar Graphs | 4th Grade & Up
Reading bar graph goes little hard this time. The increments are two-digit and three-digit numbers. Each worksheet has six bars and five word problems based on bars catering to children of grade 4.
Drawing and Interpreting Bar Graphs
At this level, scale increments are huge and the quantities are in 2-digits, hundreds and thousands.
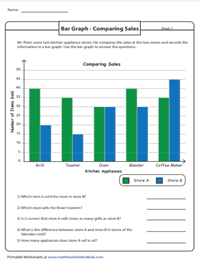
There are five sets of double bar graphs in each pdf worksheet. Practice of these handouts will substantially improve the decision-making skills of 5th grade and 6th grade students. They need to analyze and compare the data and answer the questions.
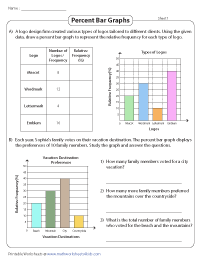
Relative Frequency and Percent Bar Graphs
Show the relative frequency of each category by drawing a percent bar graph. Then, in the next section, study the graph to answer the questions that follow.