
- Worksheets>
- Math>
- Statistics>
- Pictograph
Pictograph Worksheets
Picture graph worksheets contain cut-paste activity and reading pictographs. Students should answer the questions based on the picture graphs. These printable worksheets contain skills involving reading, drawing, grouping and more. A unique theme is maintained in each pdf worksheet, which would help students of kindergarten through grade 3 to reinforce the knowledge in analyzing the data under real-life situations. Print our free pictograph worksheets with just a click!
Picture Graph
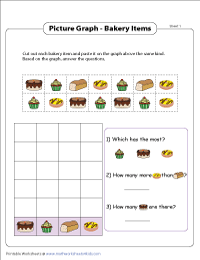
Complete the picture graph by cutting out the graphics and pasting them under the suitable category. Based on the graph, answer the questions. Suitable for kindergarten and grade 1 kids.
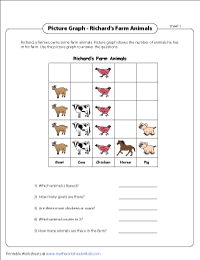
Answer the questions based on the picture graph. Each worksheet has a different theme.
Reading Pictograph
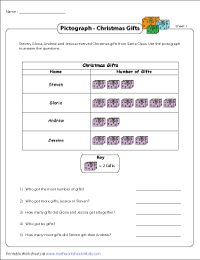
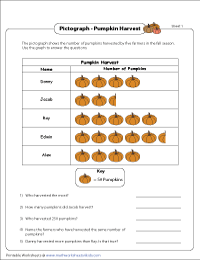
Reading Pictograph | Easy Level
This section features basic reading pictograph worksheet pdfs for 1st grade and 2nd grade children. Use the information to answer the questions. Keys: 2, 8 or 10.
Reading Pictograph | Moderate Level
The worksheets have half symbols with key varying in 2-digit numbers.
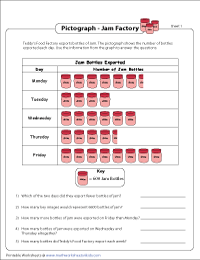
Reading Pictograph | Difficult Level
The scales are in hundreds. There are three printable 3rd grade worksheets in different themes. Calculation may be a bit heavier. Obviously, there are half symbols.
Drawing Pictograph
Draw the pictograph based on the information on tally marks. Scale varies between 2 to 10. You do not require half symbols here.
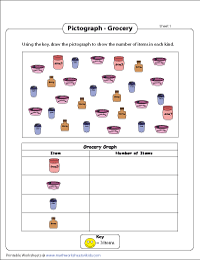
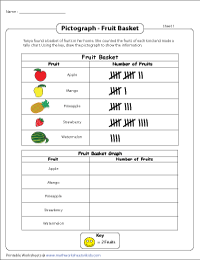
Draw the pictograph to show the count of each item. Students may group the items in 2s, 3s or 5s.
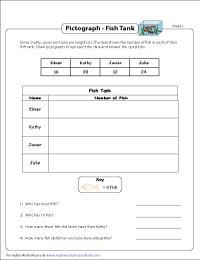
Draw pictograph to represent the data and answer the questions. Key value varies between 2 and 9.
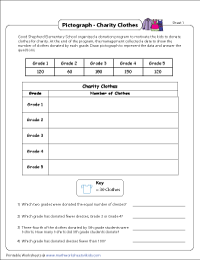
Each pdf worksheet has real-life representation with data values in the table. Show the information by drawing the pictograph. Students of grade 2 and grade 3 may use half-symbols in some places.
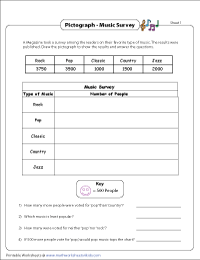
Divide each entry by key value to determine the number of symbols that go in each row. Key values take only three-digit numbers. Use half-symbols wherever necessary.