- Worksheets>
- Math>
- Statistics>
- Box and Whisker Plot
Box-and-Whisker Plot Worksheets
Box-and-whisker plot worksheets have skills to find the five-number summary, to make plots, to read and interpret the box-and-whisker plots, to find the quartiles, range, inter-quartile range and outliers. Word problems are also included. These printable exercises cater to the learning requirements of students of grade 6 through high school. Grab some of these worksheets for free!
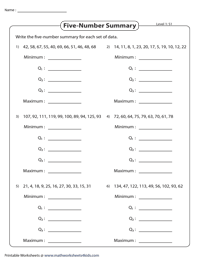
Analyze the data sets with single-digit, 2-digit, and 3-digit values, and jot down the five key values: the 1st, 2nd, and 3rd quartiles, and minimum and maximum that constitute the 5-number summary.
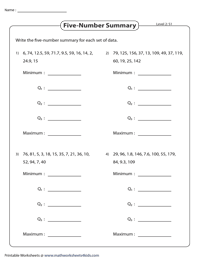
Level up identifying the upper and lower quartiles, maximum and minimum values, and median, necessary to make box and whisker plots, from data sets involving decimal values.
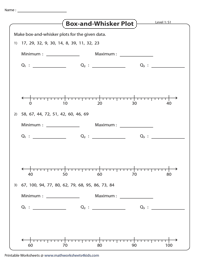
Making Box and Whisker Plots: Standard | Level 1
Constructing box plots is the next step when you’re ready with your five-number summary. Plot the five values on the graph, and create the box plot to represent the given sets of data.
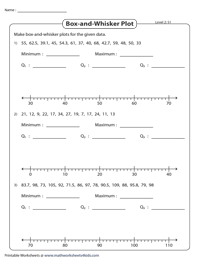
Making Box and Whisker Plots: Standard | Level 2
Climb up the ladder in making box plots with these worksheets! Observe the data sets that involve more than 10 data values and also decimals, figure out the elements of the box plot, and create it.
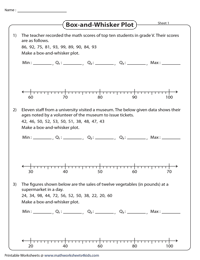
Make a Box-and-Whisker Plot: Word Problems
Read the given data carefully and determine the five-number summary to make box-and-whisker plots. Each pdf worksheet has three problems.
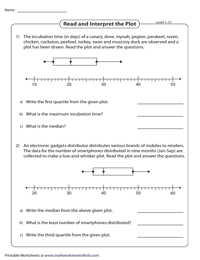
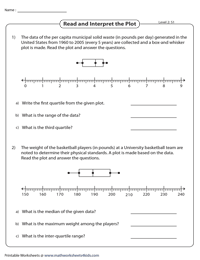
Dig into practice with these handouts for 6th grade and 7th grade students. Read the scenarios and interpret the box-and-whisker plots to answer the word problems based on the five-number summary.
These pdf worksheets for grade 7 and grade 8 have exclusive word problems to find the five-number summary, range and inter-quartile range.
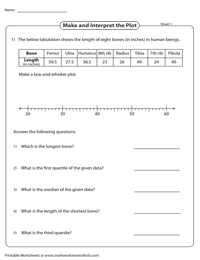
For the given data, make a box-and-whisker plot. Interpret the data to find Q1, Q2, Q3, maximum and minimum values.
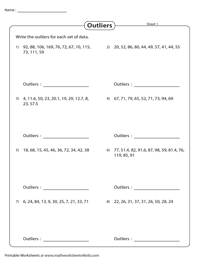
Each printable worksheet has eight problems in store for 8th grade and high school students. Find the outliers by computing the quartiles and the inter-quartile range.

