
3rd Grade Math Worksheets
Teeming with adequate practice materials, the printable 3rd grade math worksheets with answer keys should be your pick if developing an understanding of multiplication and division within 100, using place value to round numbers, working with fractions, solving problems involving measurement and estimation of intervals of time, liquid volumes, and masses of objects, getting acquainted with the concepts of area and perimeter, representing and interpreting data and the like are on your mind. Count on our free grade 3 math worksheets to kick start your journey!
Select Grade 3 Math Worksheets by Topic
Explore 180+ Third Grade Data and Graph Worksheets
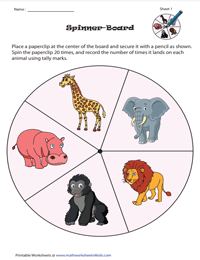
Place the paper clip at the center of the board and hold it with a pencil. Spin the paper clip and record the count on the tally chart.
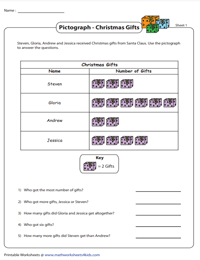
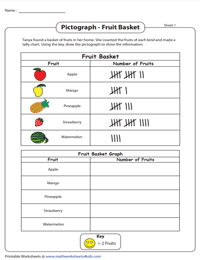
Read and analyze each pictograph by looking at the symbols that represent the data and answer the survey questions.
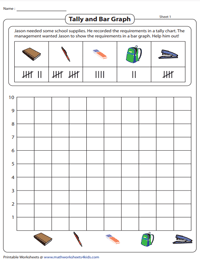
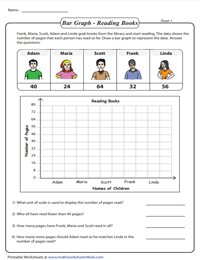
Count the tally marks and find the number in each category and then color the corresponding number of boxes to create a bar graph.
Display the values in the data set along a number line by placing a cross mark. If there are multiple occurrences, mark them vertically.
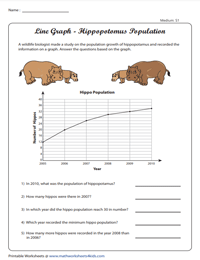
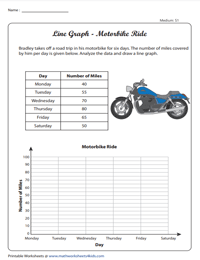
Practice, Practice, Practice! Get plenty of practice by interpreting the line graph and answering the questions.
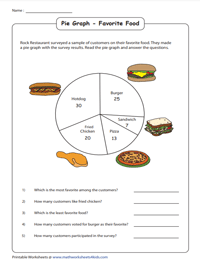
Reading Pie Graphs | Whole Numbers
Study each pie graph, observe the pie slices depicting the data and respond to the set of survey questions.
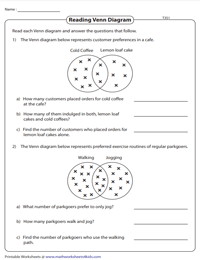
Reading Venn Diagrams Involving Two Sets | Word Problems
Read each Venn Diagram, which represents the similarities and differences between two sets and answer the questions.
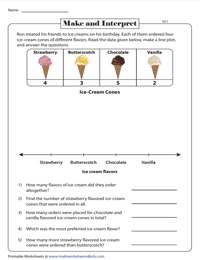
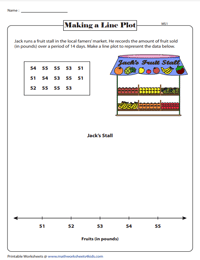
Making and Interpreting Line Plots
Using the provided data below each picture, young data analysts create a line plot by plotting it on the number line.
Drawing and Interpreting Bar Graphs
Gather and organize the data in order and create a bar graph. Interpret the graph and answer the questions.
Drawing Pictographs using Tally Marks
Collect data by counting the tally marks in the tabulated column and draw a pictograph using the given key.
Transfer the given data to the graph by plotting the points on the x axis and y axis and drawing a line connecting the data points.
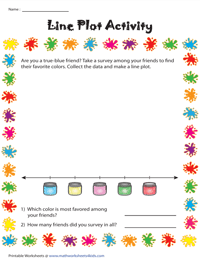
With this set of amazing activities, become a master at taking surveys. Based on your poll results, create your own line plots.