- Worksheets>
- Math>
- Pre-Algebra>
- Proportions>
- Constant of Proportionality
Constant of Proportionality Worksheets
The constant of proportionality is the ratio between two variables y and x. Interpret the constant of proportionality as the slope of the linear relationship y = kx. Find the proportional relationship between x and y values to solve this set of pdf worksheets that comprise graphs, equations, and tables. Students will also learn to find the missing values in tables based on the constant of proportionality k, so derived. These printable worksheets are specially designed for students of grade 7 and grade 8. Click on the 'Free' icon to sample our worksheets.
Constant of Proportionality - Graph
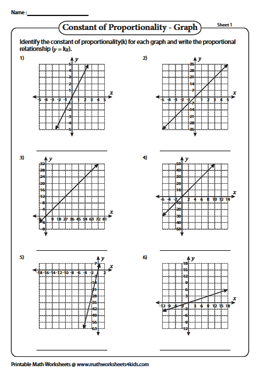
7th grade students should use the slope of each graph to identify the constant of proportionality, k. Then, find the proportional relationship between the x and y coordinates by applying the formula y = kx.
Constant of Proportionality - Draw Graphs
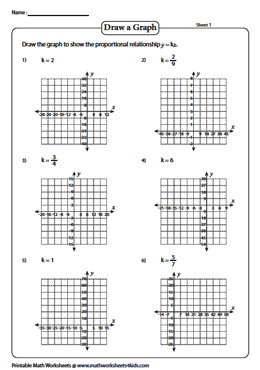
Based on the value k, draw a straight line on the graph that passes through the origin to denote the proportional relationship y = kx. Use our answer keys to validate your responses.
Constant of Proportionality - Equations
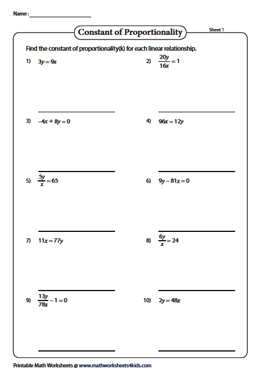
8th grade students should rewrite each equation in the form of y = kx, where 'k' represents the constant of proportion. There are ten problems in each pdf worksheet.
Constant of Proportionality - Tables
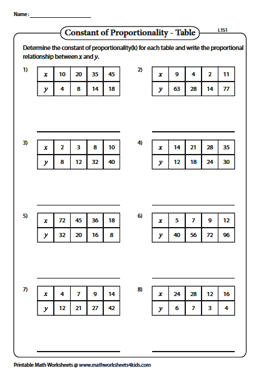
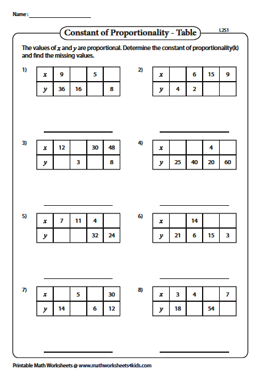
Examine the x and y values provided in each table to find the constant of proportionality, k. Then, replace the value of k in y = kx to obtain the proportional relationship between x and y.
Each printable worksheet contains eight function tables. Using the values of x and y, determine the constant of proportionality k. Based on the constant derived, complete the table.

