
5th Grade Math Worksheets
The secret to becoming a math nerd lies in the practice offered by our printable 5th grade math worksheets featuring exercises like using the order of operations involving parentheses, brackets, and braces to solve expressions, generate two-rule patterns, perform operations with multi-digit whole numbers, and with decimals to hundredths, and fractions. Convert between different-sized standard measurement units within a given measurement system, make a line plot to display a data set, measure volume by counting unit cubes, graph points on the coordinate plane and much more. Give our free math worksheets for grade 5 a try and kick-start your practice!
Select Grade 5 Math Worksheets by Topic
Explore 120+ Fifth Grade Data and Graph Worksheets
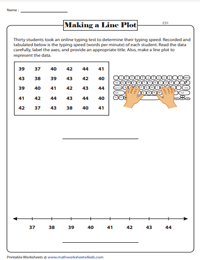
Make a Line Plot | Challenging
Create a line plot by plotting all the values in the data set on a number line. Remember to label the axis and provide a suitable title.
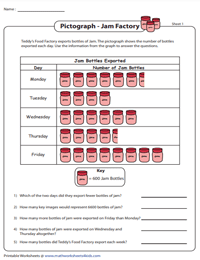
Facilitate better understanding of pictographs by reading the pictographs depicting 3-digit numbers and answering the questions.
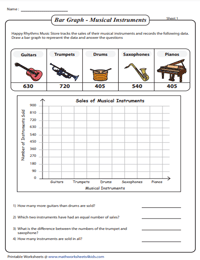
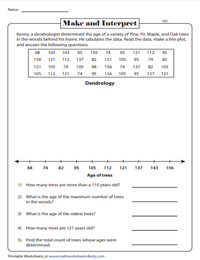
Drawing and Interpreting Bar Graphs
Organize the data given in 3-digit and 4-digit numbers and make beautiful bar graphs and also respond to the questions.
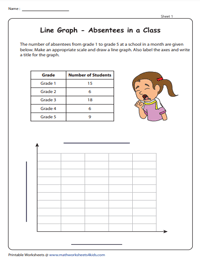
Drawing a Line Graph | More Practice
Draw a line graph using a suitable scale, label the x axis and y axis, and provide an appropriate title for the graph.
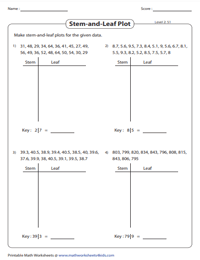
Ask the learners to build a stem and leaf plot by laying out the data in the stem and leaf parts. Interpret the data to answer the questions.
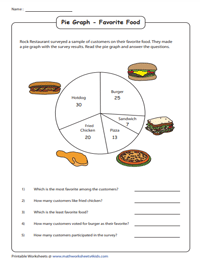
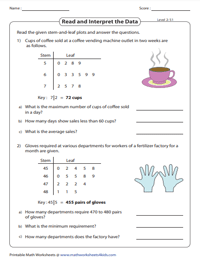
Reading Pie Graphs | Percentage
Interpret the pie slices on the pie graph as percents and answer the questions based on the graph.
Line plot is the go-to tool for visualizing data over a period of time. Make a line plot for each of the interesting scenarios in this set.
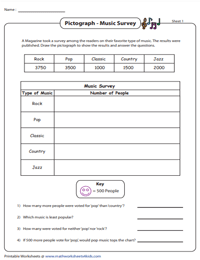
Decide which picture you're going to use to depict the data, divide the data in each type by the key and draw the required number of pictures.
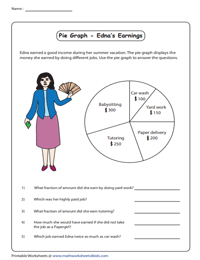
Pie Graph | Convert from Whole Numbers to Fraction
With this set of cute pie graphs, answer the questions that require you to represent the whole numbers in fractions.
Stem and Leaf Plots | Read and Interpret
Interpret the two-column table featuring stems on one side and leaves on the other side, and solve the word problems.
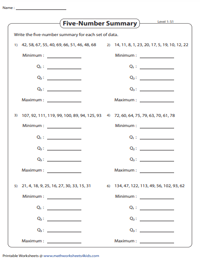
Complete the five-number summary which consists of minimum, first quartile, median, third quartile, and maximum.
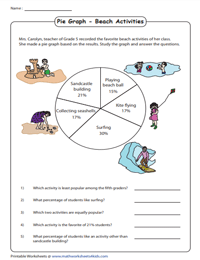
Interpreting Pie Graphs | Percents
Presenting a set of pie graphs with three different themes, this resource can be used to test the skills of learners in analyzing the data given in percents.