
- Worksheets>
- Math>
- Statistics>
- Frequency Tables
Frequency Tables Worksheets
Help children learn to organize and interpret data using our frequency table worksheets, which include answer keys. Start by filling in frequency tables for both categorical and numerical data, and then progress to summarizing information with two-way frequency tables. Finally, wrap up by calculating relative frequencies. Get started with our free worksheets.

Frequency Charts | Ungrouped Data
Determine how often each data point appears in the dataset, and record its frequency in a table. Then, proceed to answer the questions that follow.

Frequency Tables | Grouped Data
Summarize the numerical data in the given class intervals to complete the frequency tables with these worksheets.
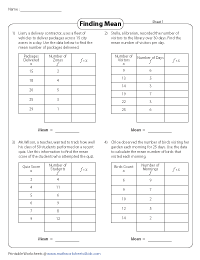
Finding the Mean | Frequency Tables
Get kids to multiply each data value by its corresponding frequency and then add all these products and divide by the total frequency to determine the mean.

Examine the frequency table for two categorical values, interpret, and answer the questions based on the given data in these worksheets.
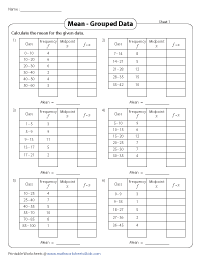
Finding the Mean | Grouped Data
To find the mean from grouped data, multiply each class midpoint by its frequency, add the results, and divide by the total frequency in these pdfs.

Finding Mean, Median, and Mode
Analyze the grouped data displayed on a frequency distribution table and apply the relevant formulas to calculate the mean, median, and mode in these frequency tables worksheets.

Creating and Interpreting Relative Frequency Tables
Analyze the table in these printables, calculate the relative frequency for each category, and answer the questions based on the given scenario.

Relative Frequency | Word Problems
Use these worksheets to determine the relative frequency by identifying how often a specific event occurs in relation to the total number of events in each scenario.

Relative Frequency | Percent Bar Graphs
Represent the relative frequency of each category by creating a percent bar graph in the first part. Analyze the graph to answer the follow-up questions in the next part.