
- Worksheets>
- Math>
- Statistics>
- Scatter Plot
Scatter Plot Worksheets
Our scatter plot worksheets guide learners in grade 8 and high school through analyzing trends and associations in bivariate data. Each exercise helps identify trends, correlations, outliers, and clusters, while also creating scatter graphs, interpreting data, identifying lines of best fit, and predicting trends. Try our free worksheets for a great start.
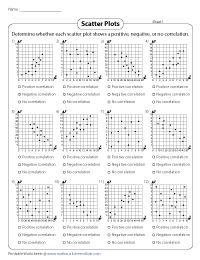
Identifying Correlations in Scatter Plots
Identify trends by analyzing the direction of the points in these worksheets. Determine whether each plot shows positive, negative, or no correlation.
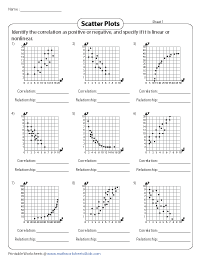
Recognizing Trends and Relationships
Examine each scatter plot to see if the variables rise or fall together. Straight lines indicate linear relationships, while curves indicate nonlinear relationships.
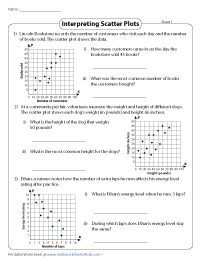
Study each scatter plot for bivariate data and answer questions by investigating patterns and associations to draw conclusions in these scatter plot worksheets.
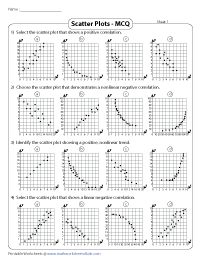
Analyze scatter plots to interpret correlation types, including positive, negative, linear, and nonlinear correlations.
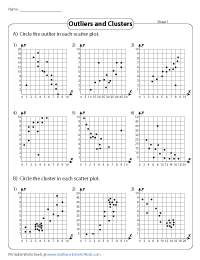
Identifying Outliers and Clusters
In these printable worksheets, circle outliers or stand-alone points that are much higher or lower, and highlight clusters or points that are close together.
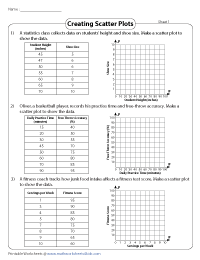
Plot each pair of bivariate values to construct a scatter plot and observe the relationship between the two variables.
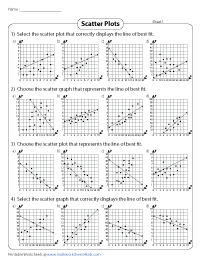
Choose the graph with a balanced line passing close to most data points, with roughly equal points above and below the line in these PDF worksheets.
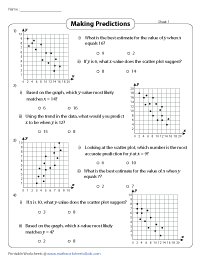
Follow the overall trend, summarize the relationship between the two variables, and predict trends for one variable based on another.