
- Worksheets>
- Math>
- Algebra>
- Functions>
- Graphing Linear Function
Graphing Linear Function Worksheets
This extensive set of pdf worksheets includes exercises on graphing linear function by plotting points on the grid. Three types of function tables, each with two levels of worksheets, require learners in grade 8 and high school to plot the points and graph the lines. The graph of a linear function is always a straight line. Use the answer keys provided to verify your responses. Employ the various download options to gain access to all our worksheets under this topic. A number of free printable worksheets are also up for grabs!
Printing Help - Please do not print worksheets with grids directly from the browser. Kindly download them and print.
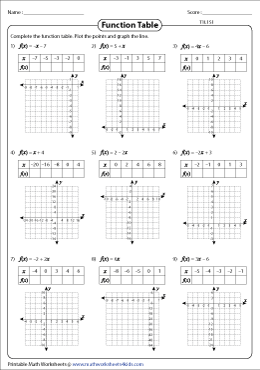
Graphing Linear Function: Type 1 - Level 1
Find f(x) based on the x-coordinates provided and complete the function tables. Plot the points and graph the lines. The slopes given in level 1 worksheets are in the form of integers. Verify your graph with the answer keys provided.
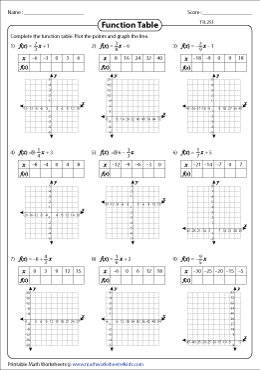
Graphing Linear Function: Type 1 - Level 2
These pdf worksheets provide ample practice in plotting the graph of linear functions. The slopes are represented as fractions in the level 2 worksheets. For the given x-coordinates, find f(x) and complete the function tables. Plot the points and graph the linear function.
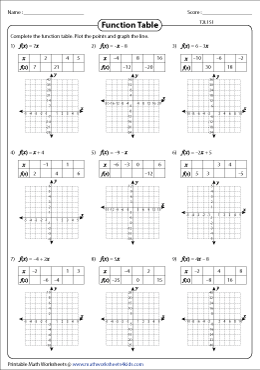
Graphing Linear Function: Type 2 - Level 1
In this section, 8th grade and high school students will have to find the missing values of x and f(x). Complete the function table, plot the points and graph the linear function. The slopes in level 1 worksheets are in the form of integers.
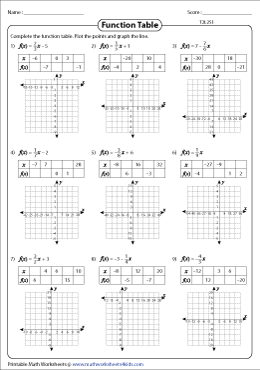
Graphing Linear Function: Type 2 - Level 2
Write down the missing values of x and f(x). There are nine linear functions in each worksheet with the slopes in the form of simplified fractions. Plot the coordinates and graph the lines.
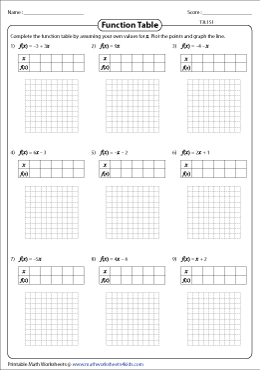
Graphing Linear Function: Type 3 - Level 1
Assume your own values for x for all printable worksheets provided here. Find the range. Compute the function tables, plot the points, and graph the linear functions. The slopes provided in level 1 worksheets are represented as integers.
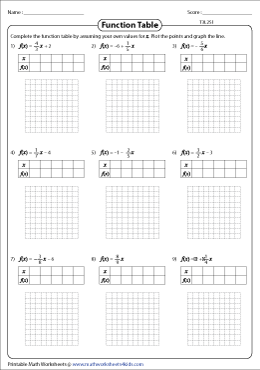
Graphing Linear Function: Type 3 - Level 2
The equations in the second level of worksheets have slopes in the form of fractions. Assign five values of x and find the corresponding values of f(x). Plot the points and graph the linear function. Download our easy-to-print worksheets for ample practice.
Related Worksheets