
2nd Grade Math Worksheets
Our printable 2nd grade math worksheets with answer keys open the doors to ample practice, whether you intend to extend understanding of base-10 notation, build fluency in addition and subtraction of 2-digit numbers, gain foundation in multiplication, learn to measure objects using standard units of measurement, work with time and money, describe and analyze shapes, or draw and interpret picture and bar graphs, there's something to interest kids and keep them engaged. Our free math worksheets for grade 2 kids definitely need to be added to your must-try list!
Select Grade 2 Math Worksheets by Topic
Explore 180+ Second Grade Data and Graph Worksheets

Reading Pictographs (Picture Graphs) | Key: 2,8,10
Read the pictograph depicting attractive items like gifts, juices, and dolls, and answer the questions that follow.
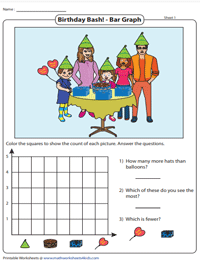
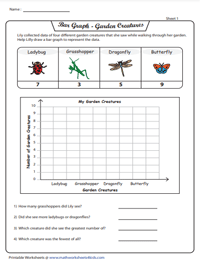
Counting, Coloring, and Creating Bar Graphs | Theme
Take a gander at each theme, count the indicated items, color the graph, and crack the questions beside.
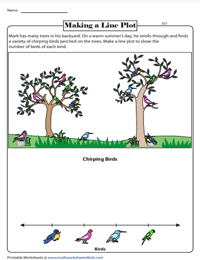
Count the colored birds, pond animals, and decorative items, put x marks above the line, and create the line plots.
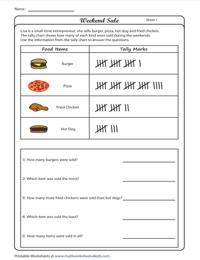
Reading Tally Graphs: Word Problems
Read and interpret the tally chart which represents a variety of eye-catching graphics using tally marks.
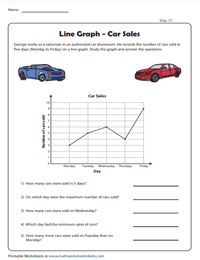
Observe the data points connected by lines and respond to questions about the number of cars sold, money saved, and more.
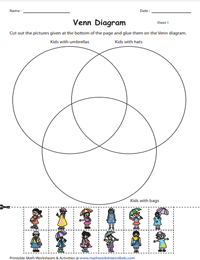
Venn Diagrams: Cut and Glue Activity
Look at the caption above each circle; cut out the pictures at the bottom; glue them on the apt circle to complete the Venn diagram.
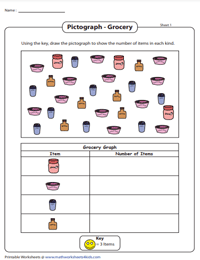
Drawing Pictographs - Count and Group | Key: 3,5,2
Count the items on the depiction, and create a pictograph to represent the number of items of each kind using the key.
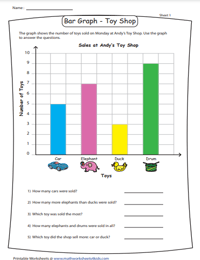
Go over the bar graphs that represent three different scenarios and interpret the data.
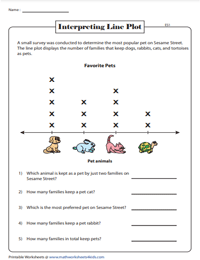
Various surveys are rendered in the line plots. Examine them, interpret the data, and answer the questions below.
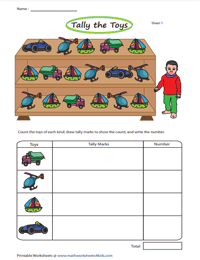
Tally: Classifying and Counting | Theme-Based
Glance at the theme, count the pictures in each kind, represent them using tally marks, and also write the numerical value.
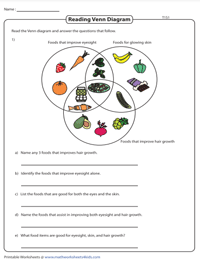
Reading Venn Diagrams: Word Problems
Read the Venn diagram incorporating images of three sets. Analyze the union and intersection of the sets and answer the questions.
Drawing and Interpreting Bar Graphs
Sketch a bar graph to illustrate the data collection by plotting the points according to the counts, and interpret it.