
- Worksheets>
- Math>
- Algebra>
- Inequalities>
- Graphing Linear Inequalities
Graphing Linear Inequalities Worksheets
This ensemble of printable graphing linear inequalities worksheets drafted for high school students assists in comprehending the use of inequalities when there is a range of possible answers. Identify the shaded region, and the type of boundary line as dashed or solid, complete the inequality, check if the ordered pair is a solution, identify the inequalities, shade the region, graph the inequalities and much more. The inequality is expressed in slope-intercept form in level 1 and has to be converted to slope-intercept form in Level 2. Our free graphing linear inequalities worksheets are a good place to begin practice.
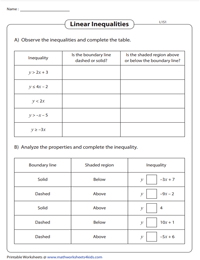
Complete the Property Table - Level 1
The boundary lines in this set of graphing two-variable linear inequalities worksheets are in the slope-intercept form. Observe the inequality and complete the table in Part A. Analyze the properties of the line and write the inequality in Part B.
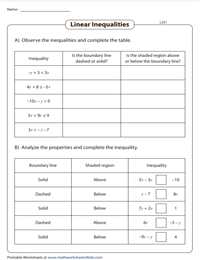
Complete the Property Table - Level 2
Rearrange the inequality in the slope-intercept form. High school students are expected to write if the line is dashed or solid and if the shaded region is above or below in Part A and complete the inequality in Part B in these pdfs.
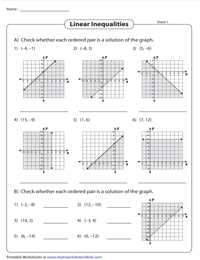
Is the Ordered Pair a Solution to the Linear Inequality?
Determine if an ordered pair is a solution of the graph. Figure out if the pair lies in the shaded region. If it does, then it is a solution and not otherwise. Try a variant by checking if a set of coordinates are solutions.
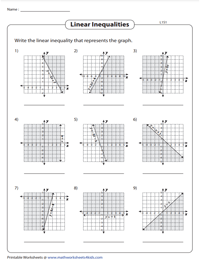
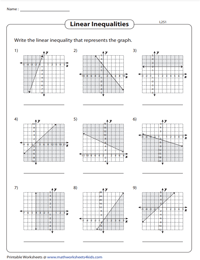
Observe the Graph and Identify the Inequality - Level 1
The boundary line of each graph is specified in these printable worksheets. Check if the line is solid or dashed, and the position of the bounded region is above or below and write the inequality in two variables based on the stated properties.
Observe the Graph and Identify the Inequality - Level 2
Augment skills with this batch of linear inequalities worksheets, where the equation of the boundary line is not indicated. Direct students to determine the boundary line equation and then identify the inequality.
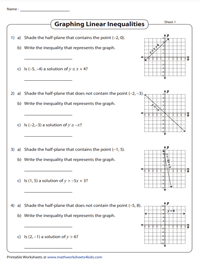
Observe the Graph and Answer the Questions
High school learners are expected to answer a set of questions based on the graph. Shade the half-plane that contains or doesn't contain the ordered pair as specified in the question and identify the inequality as well.
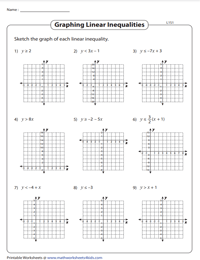
Graph the Inequality - Level 1
Map each inequality on a coordinate plane. Substitute a list of random coordinates in the inequality given and graph the line as dotted or solid on the x-y plane and shade the region of possible solutions in these graphing linear inequalities worksheet pdfs.
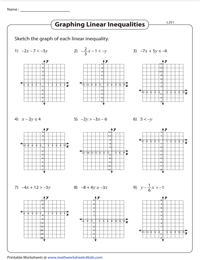
Graph the Inequality - Level 2
The line is not expressed in the slope-intercept form. Rearrange the equation, so that it solves for y and graph the inequality in two variables using a coordinate plane and find the full range of possible solutions.